Setting Up VSCode to Debug CPython: Your Gateway to Python Internals

Have you ever wondered how Python’s interpreter executes your code? In the first part of this series, we explored what happens when you run python main.py—from tokenization to bytecode execution. But to truly understand how Python works, we need to go deeper. And what better way to do that than by debugging the CPython source code itself?
In this article, we’ll set up VSCode to debug CPython. Why VSCode? Because it’s one of the most popular code editors, and its powerful debugging tools make it perfect for exploring C code. By the end of this guide, you’ll be able to:
Step through CPython’s C code.
Set breakpoints and inspect variables.
So, let’s get started and turn VSCode into your ultimate tool for exploring Python’s internals!
Prerequisites
Before we dive into setting up VSCode to debug CPython, there are a few things you should know and have in place. This will ensure you can follow along smoothly and get the most out of this guide.
1. Read Part 1 of This Series
This article builds on the concepts introduced in Part 1, where we discussed what happens when you run python main.py and introduced the idea of exploring CPython’s internals. If you haven’t read it yet, I highly recommend checking it out first: Link to Part 1 local
2. Basic Command-Line Skills (Optional)
You’ll need to run commands in the terminal to clone repositories, build Python, and install tools. If you’re not comfortable with the command line, take some time to learn the basics. Here’s a quick guide to get you started: Command Line Basics for Beginners
3. How to Install Missing Packages
If any tools or packages mentioned in this guide are missing on your system, you’ll need to install them. Here’s how:
On Ubuntu/Debian: Use apt-get to install packages. For example:
sudo apt-get install
On macOS: Use brew (Homebrew) to install packages. For example:
brew install
On Windows: Use tools like choco (Chocolatey) or download installers from official websites.
4. Curiosity and Willingness to Learn
Debugging CPython’s C code isn’t something you do every day, and it can feel intimidating at first. But don’t worry — this guide is designed to make it as approachable as possible. The most important prerequisite is your interest in learning and your willingness to experiment. If you’re excited to understand how Python works under the hood, you’re already halfway there!
Steps to Set Up VSCode for Debugging CPython
Now that you’ve got the prerequisites covered, let’s dive into the fun part: setting up VSCode to debug CPython. By the end of this section, you’ll have a fully functional debugging environment ready to explore Python’s internals.
Step 1: Clone the CPython Repository — Your Gateway to Python’s Source Code
If you haven’t already, clone the CPython repository to get the source code:
git clone https://github.com/python/cpython.git
cd cpython
This is where the magic happens — Python’s entire implementation, written in C, is now at your fingertips.
Step 2: Build Python in Debug Mode — Unleashing the Power of Debug Symbols
To debug CPython effectively, we need to build it in debug mode. This enables additional checks and debugging symbols that make it easier to trace execution.
Run the configure script with the --with-pydebug flag:
./configure --with-pydebug
Compile Python using make:
make -j8
The -j8 flag speeds up the build by using 8 threads (adjust this based on your CPU).
Once the build is complete, you’ll have a custom Python executable in the cpython directory. Test it by running:
./python --version
Step 3: Install VSCode and Extensions — Your Debugging Toolkit
Install VSCode: Download and install Visual Studio Code if you haven’t already.
Install Extensions:
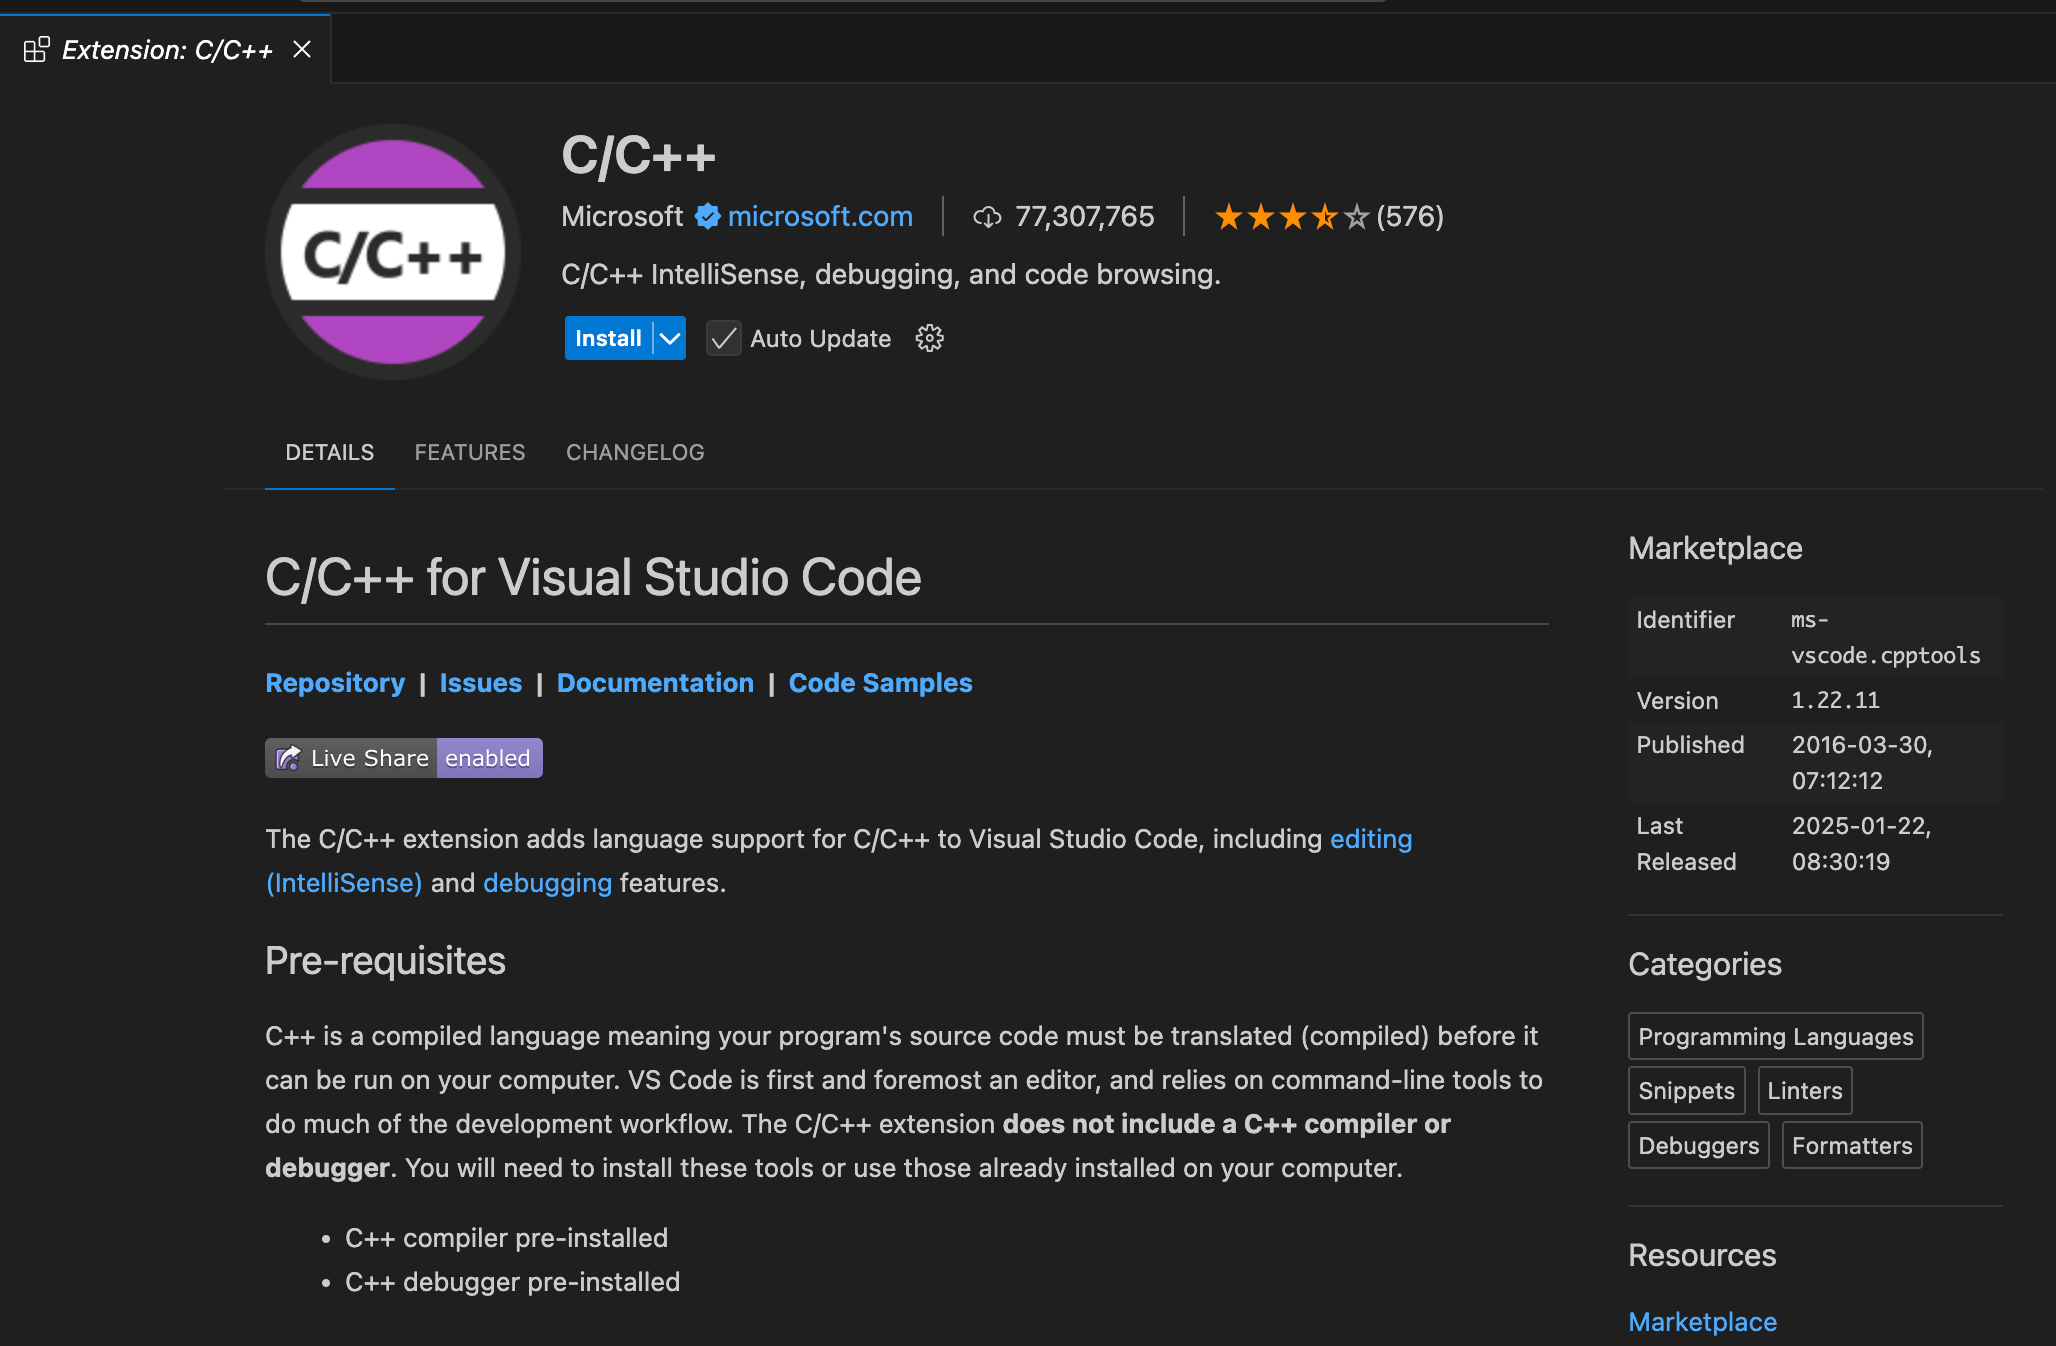
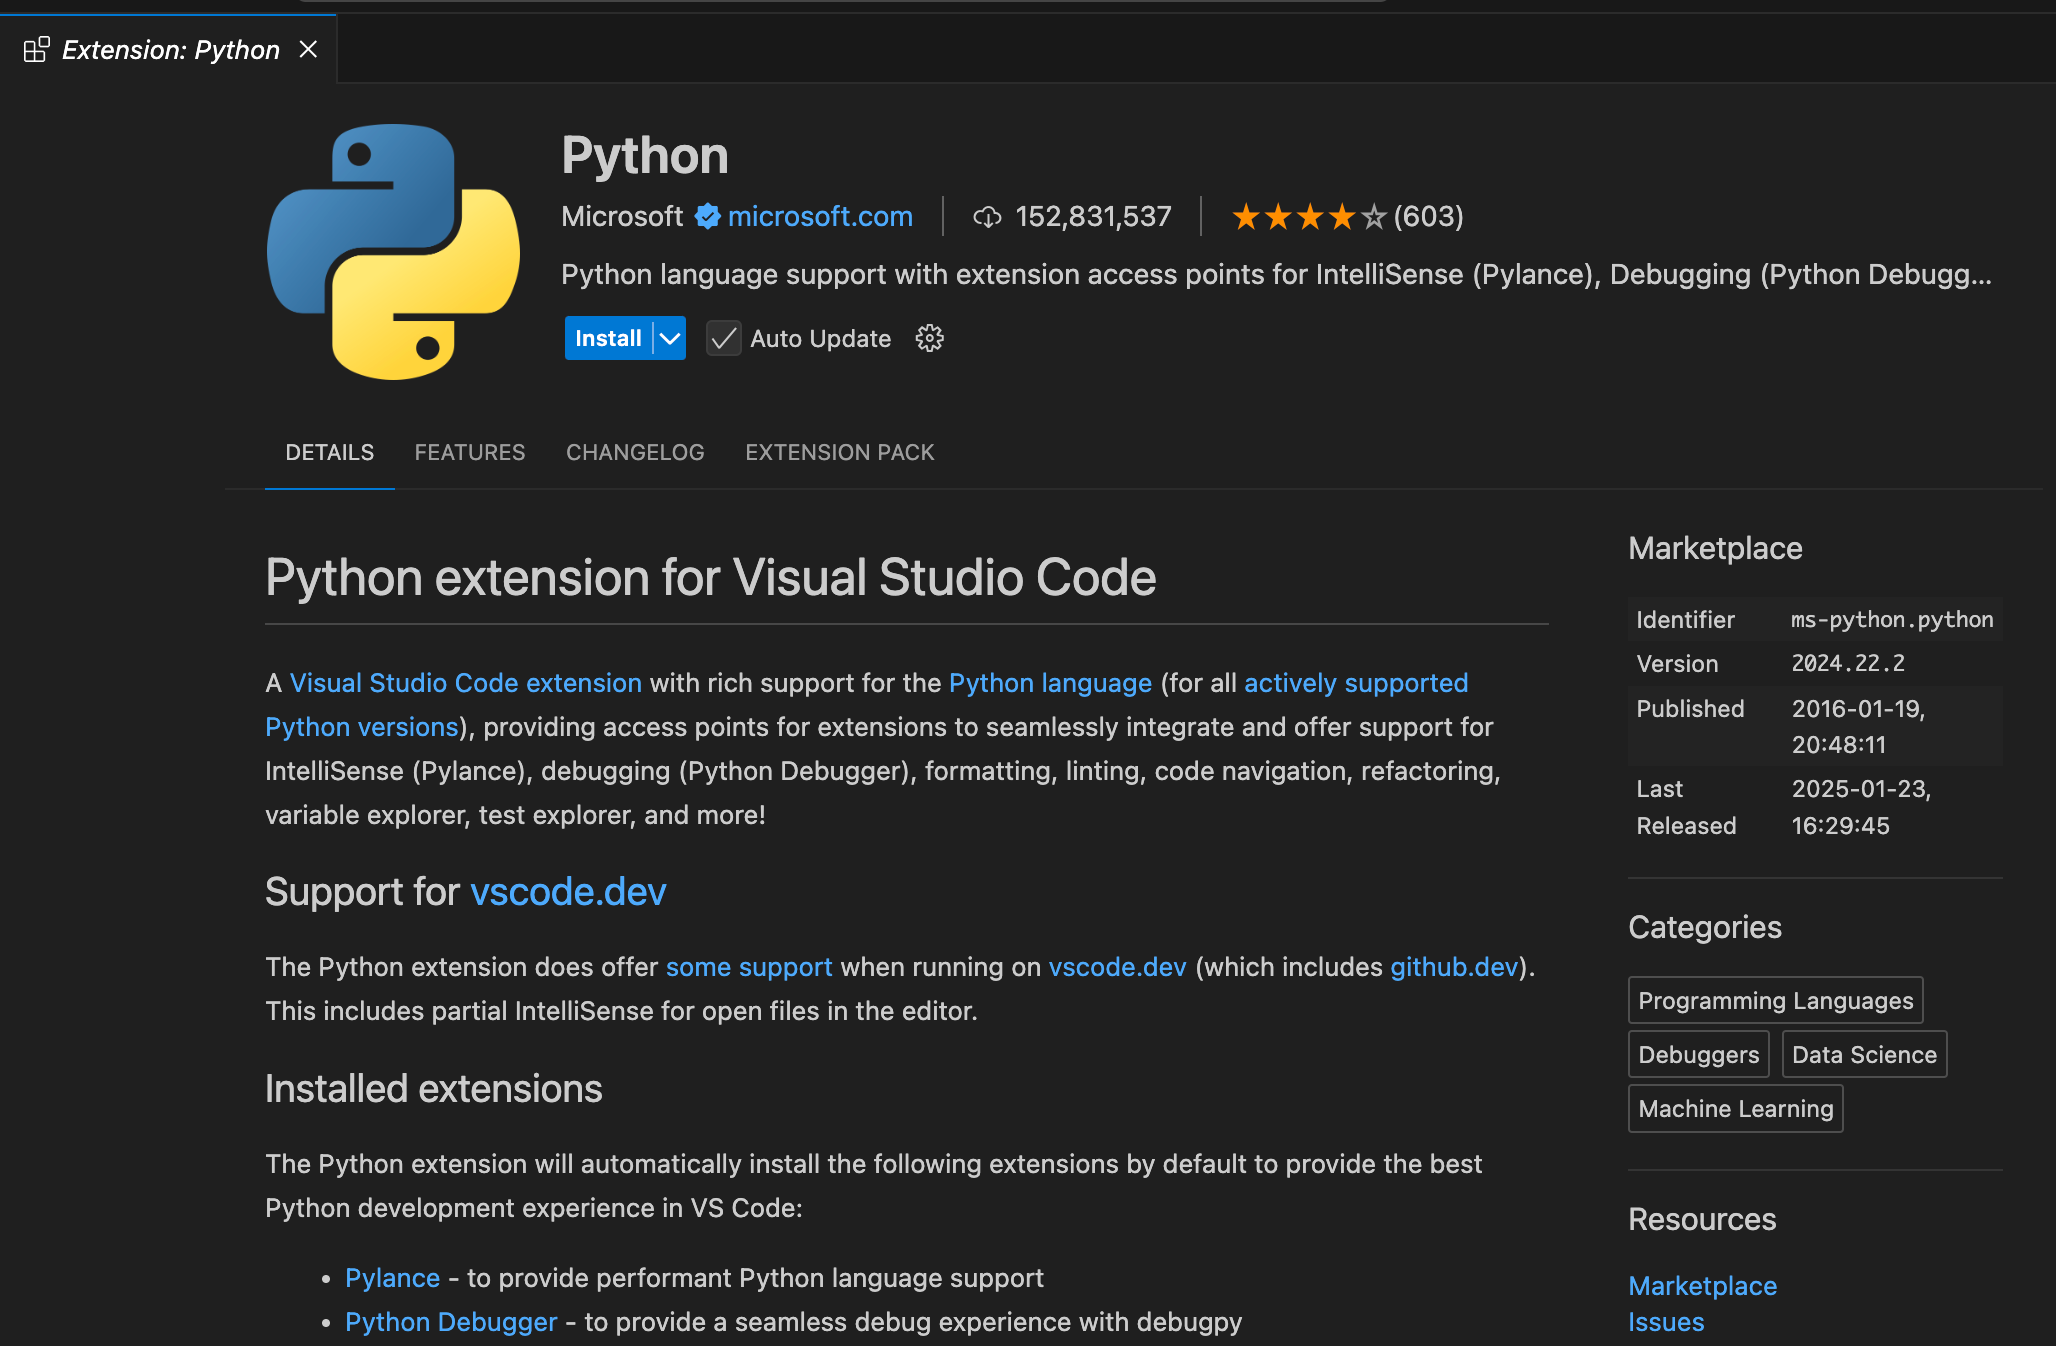
C/C++: For debugging C code.
Python: For Python language support. You can install these from the Extensions Marketplace in VSCode.


Step 4: Configure VSCode for Debugging — Setting the Stage
Now, let’s configure VSCode to debug CPython’s C code.
Open the cpython folder in VSCode.
Create a .vscode folder in the root directory (if it doesn’t exist).
Add a launch.json file with the following configuration:
For Windows or Linux:
{
  "version": "0.2.0",
  "configurations": [
    {
      "name": "Debug CPython",
      "type": "cppdbg",
      "request": "launch",
      "program": "${workspaceFolder}/python",
      "args": ["${workspaceFolder}/path/to/your_script.py"],
      "stopAtEntry": false,
      "cwd": "${workspaceFolder}",
      "environment": [],
      "externalConsole": false,
      "MIMode": "gdb",
      "setupCommands": [
        {
          "description": "Enable pretty-printing for gdb",
          "text": "-enable-pretty-printing",
          "ignoreFailures": true
        }
      ]
    }
  ]
}
Replace "${workspaceFolder}/path/to/your_script.py" with the path to your Python script.
For MAC OS:
From my experience in MAC, lldm will be the best fit. Don’t worry — LLDB works just as well! Here’s how to set it up:
Install LLDB: It comes pre-installed with Xcode. If you don’t have Xcode, install it from the App Store or install the Xcode command-line tools:
xcode-select --install
Update launch.json: Replace "MIMode": "gdb" with "MIMode": "lldb" in your launch.json file.
Debug as Usual: LLDB works similarly to GDB, so you can follow the same steps to set breakpoints and step through the code.
Step 5: Write a Simple Python Script — Your Debugging Playground
Create a main.py file in your workspace:
# /{workspaceFolder}/main.py
print("hello world")
This simple script will help us trace how Python processes a function call and prints output.
Step 6: Set Breakpoints and Debug — Stepping into the C Code
Open a C file in the CPython source code (e.g., Programs/python.c).
Set a breakpoint at a function like main or wmain.
Press F5 to start debugging.
Step through the code, inspect variables, and see how Python executes your script.
Common Issues and Troubleshooting
Debugger not working: Ensure you’ve built Python in debug mode (--with-pydebug).
Missing GDB: Install GDB using sudo apt-get install gdb (Linux) or equivalent for your OS.
VSCode configuration errors: Double-check your launch.json file for typos or incorrect paths.
What’s Next?
Now that you’ve set up VSCode for debugging CPython, it’s time to start exploring the code! In the next part of this series, we’ll take a closer look at how the Python runtime is initialized. This is where everything begins — when you run python main.py, the interpreter sets up the environment, initializes core components, and prepares to execute your script.
We’ll:
Trace the initialization process step by step.
Use our debugging setup to step through the relevant C code.
Explore key functions like Py_Initialize() and Py_Main().
By starting small, we’ll build a solid foundation for understanding the bigger picture. Get ready to see how Python boots up and gets ready to run your code!
Join the Deep Dive
If you’ve successfully set up VSCode and are excited to dive into the initialization process, let me know in the comments! If you ran into any issues or have questions, feel free to ask — I’m here to help.
And if you’re curious about how Python gets started under the hood, make sure to follow or subscribe so you don’t miss the next part. Let’s keep exploring Python’s internals together — one step at a time!